Market Outlook
May 26, 2017
Market Cues
Domestic Indices
Chg (%)
(Pts)
(Close)
Indian markets are likely to open on positive bias tracking Global markets.
BSE Sensex
1.5
448
30,750
The S&P 500 and Nasdaq Composite closed at fresh records, as U.S. stocks
Nifty
1.6
149
9,510
advanced for a sixth straight session, thanks in part to big gains in shares of Best
Mid Cap
1.3
189
14,227
Buy after quarterly results. The DJIA, gained 0.3%, to close at 21,083.The S&P 500
Small Cap
2.0
292
14,849
index, rose +0.44% to finish at 2,415.07, after setting an intraday record of
2,419.The Nasdaq Composite added +0.7%, to end at 6,205.The US indices ended
Bankex
2.8
721
26,291
up, helped by yesterday’s release of the [Federal Open Market Committee] meeting
minutes which suggested there will be a very gradual and thoughtful balance sheet
Global Indices
Chg (%)
(Pts)
(Close)
normalization process.
Dow Jones
0.3
171
21,083
The U.K. market ended slightly higher on Thursday as the impact from a weaker
Nasdaq
0.4
42
6205
pound outweighed a drop for energy companies after OPEC agreed to extend
FTSE
0.0
03
7,518
output curbs. The FTSE 100 ended with gain of less than +0.1% to end at 7,518.
Nikkei
(00.4
70
19,813
Hang Seng
0.8
202
25,631
The Indian markets had a roaring day with the Benchmark Sensex hitting new highs.
Strong global cues after the US Federal Reserve’s cautious approach towards rate
Shanghai Com
1.4
44
3,108
hike in the near term was further supported by fresh buying in the domestic markets.
Banking stocks were in limelight and Pvt Lenders like ICICI Bank, HDFC Bank and
Advances / Declines
BSE
NSE
Yes Bank closed with strong note.
Advances
1,868
1,237
News Analysis
Declines
1,835
424
Cipla 4QFY17 result review
Unchanged
142
96
Sun Pharma 4QFY17 result preview
Tech Mahindra 4QFY17 result preview
Detailed analysis on Pg2
Volumes (` Cr)
BSE
3,399
Investor’s Ready Reckoner
NSE
35,127
Key Domestic & Global Indicators
Stock Watch: Latest investment recommendations on 150+ stocks
#Net Inflows (` Cr)
Net
Mtd
Ytd
Refer Pg6 onwards
FII
(56359
( 9,583
51,594
Top Picks
MFs
8663
6,725
27,407
CMP
Target
Upside
Company
Sector
Rating
(`)
(`)
(%)
Top Gainers
Price (`)
Chg (%)
Blue Star
Capital Goods
Buy
644
760
18.0
Dewan Housing Fin. Financials
Buy
406
520
28.2
Sintexem
126
38.3
Mahindra Lifespace Real Estate
Buy
427
522
22.3
Jpassociat
11
22.5
Navkar Corporation Others
Buy
206
265
28.4
Jisljaleqs
97
12.3
KEI Industries
Capital Goods
Buy
201
239
18.5
Bharatfin
735
9.9
More Top Picks on Pg4
Hcc
41
7.1
Key Upcoming Events
Previous
Consensus
Date
Region
Event Description
Reading
Expectations
Top Losers
Price (`)
Chg (%)
May 26, 2017 Euro Zone Euro-Zone Consumer Confidence
(3.30)
--
Dishtv
282
(11.2)
May 30, 2017 US
GDP Qoq (Annualised)
0.70
0.90
Videoind
53
(9.9)
US
Consumer Confidence
120.30
119.90
Lupin
1,138
(7.3)
May 31, 2017 Germany PMI Manufacturing
59.40
--
Aiaeng
1,322
(5.4)
Germany Unemployment change (000's)
(15.00)
--
Den
88
(4.2)
Jun 01, 2017 China
PMI Manufacturing
51.20
51.00
#as on May 25, 2017
More Events on Pg5
Market Outlook
May 26, 2017
Result Review
Cipla (CMP: `504 / TP: `465 / Upside: (7.7%))
For 4QFY2017, the company, posted bad set of numbers, a part being related to
extra-ordinary items. For the quarter the sales, came in at `3487cr V/s `3,817cr,
registering a yoy growth of 8.7%, aided by robust growth in export markets.
Exports (`2385cr), posted a yoy growth of 22.4%, while domestic formulation
(`1197cr), posted a yoy dip of 4.8%. On the OPM front the EBDITA Margins came
in at 11.8% V/s 16.8% expected V/s 5.0% in 4QFY2016. The results for the
quarter include one-off charges related to impairment of a part of intangibles from
its US acquisition and a provision for loss on certain assets of its subsidiary Cipla
BioTec Pvt. Ltd (`56cr). Also, during the quarter the company posted `214cr
impairment charges pertaining to intangible assets of US Generics business. Thus
the company posted net loss of `62cr V/s profit of `299cr expected V/s profit of
`81cr in 4QFY2016. For the financial year, company filled 32 ANDAs, much
ahead of its guidance range of 20-25 ANDAs. The R&D expenses during the
quarter were 8.8% of sales. We maintain our reduce on the stock.
Result Preview
Sun Pharmaceuticals (CMP: `592 / TP: `847 / Upside: 43.1%)
For 4QFY2017, the company is expected to post tepid numbers, aided by US
sales. For the quarter the sales is expected to come in at `7,600cr, registering a
yoy growth of 2.5%. On the OPM front the EBDITA Margins are expected to come
in at 31.1% V/s 31.0% in 4QFY2016. Thus the Adj. net profit is expected to come
in at `1,433cr, a yoy dip of 15.8%. We maintain our buy on the stock, on back of
valuations.
Tech Mahindra (CMP: `427 / TP: `600 / Upside: 40.5%)
For 4QFY2017, the company is expected to post robust numbers. For the quarter
the sales is expected to come in at US$ 1,129mn, registering a qoq growth of
1.2%. on Rupee front the sales is expected to come in at `7,533cr, a qoq de-
growth of 0.3%. On the OPM front the EBDITA and EBIT Margins of 15.5% and
12.2%, qoq dip of 17 and 18 bps. Thus the Adj. net profit is expected to come in
at `741cr, qoq dip of 12.3%. We maintain our buy on the stock, on back of
valuations.
Economic and Political News
Rupee strengthens against US dollar on Fed rate signal
Cost of demonetisation: 1.52 mn casual workers in eight sectors lost jobs
Railways to set up ` 35,000 cr fund to finance infra projects
Corporate News
Moody’s downgrades IDBI Bank rating on weak capitalization
Mahindra to expand electric vehicle line-up
Britannia Industries Q4FY17 PAT up 6% at ` 211 cr
Market Outlook
May 26, 2017
Quarterly Bloomberg Brokers Consensus Estimate
Sun Pharmaceutical Industries Ltd Consol - May 26, 2017
Particulars ( ` cr)
4QFY17E
4QFY16
y-o-y (%)
3QFY17
q-o-q (%)
Net sales
7,803
7,414
5.2
7,683
1.6
EBITDA
2,365
2,520
(6.2)
2,453
(3.6)
EBITDA margin (%)
30.3
34.0
31.9
Net profit
1,525
1,714
(11.0)
1,472
3.6
ITC Ltd - May 26, 2017
Particulars ( ` cr)
4QFY17E
4QFY16
y-o-y (%)
3QFY17
q-o-q (%)
Net sales
10,708
10,062
6.4
9,149
17.0
EBITDA
3,927
3,687
6.5
3,546
10.7
EBITDA margin (%)
36.7
36.6
38.8
Net profit
2,682
2,495
7.5
2,647
1.3
Tech Mahindra Ltd Consol - May 26, 2017
Particulars ( ` cr)
4QFY17E
4QFY16
y-o-y (%)
3QFY17
q-o-q (%)
Net sales
7,533
6,884
9.4
7,558
(0.3)
EBITDA
1,177
1,161
1.3
1,187
(0.8)
EBITDA margin (%)
15.6
16.9
15.7
Net profit
770
897
(14.2)
856
(10.0)
Oil & Natural Gas Corp Ltd - May 26, 2017
Particulars ( ` cr)
4QFY17E
4QFY16
y-o-y (%)
3QFY17
q-o-q (%)
Net sales
21,204
16,140
31.4
19,934
6.4
EBITDA
10,877
4,489
142.3
9,006
20.8
EBITDA margin (%)
51.3
27.8
45.2
Net profit
5,251
4,416
18.9
4,352
20.7
DLF Ltd Consol - May 26, 2017
Particulars ( ` cr)
4QFY17E
4QFY16
y-o-y (%)
3QFY17
q-o-q (%)
Net sales
2,100
2,336
(10.1)
2,058
2.0
EBITDA
960
1022
(6.5)
958
0.2
EBITDA margin (%)
45.7
43.8
46.5
Net profit
135
132
2.0
98
37.6
Market Outlook
May 26, 2017
Quarterly Bloomberg Brokers Consensus Estimate (contd…)
Hindustan Petroleum Corp Ltd - May 26, 2017
Particulars ( ` cr)
4QFY17E
4QFY16
y-o-y (%)
3QFY17 q-o-q (%)
Net sales
50,277
42,126
19.4
48,486
3.7
EBITDA
2,004
2,661
(24.7)
2,803
(28.5)
EBITDA margin (%)
4.0
6.3
5.8
Net profit
1,149
1,553
(26.0)
1,590
(27.7)
Divi's Laboratories Ltd - May 26, 2017
Particulars ( ` cr)
4QFY17E
4QFY16
y-o-y (%)
3QFY17 q-o-q (%)
Net sales
1,203
1,093
10.0
973
23.6
EBITDA
431
398
8.3
381
13.2
EBITDA margin (%)
35.8
36.4
39.1
Net profit
330
322
2.4
268
23.0
Market Outlook
May 26, 2017
Top Picks ★★★★★
Market Cap
CMP
Target
Upside
Company
Rationale
(` Cr)
(`)
(`)
(%)
Strong growth in domestic business due to its leadership
in acute therapeutic segment. Alkem expects to launch
Alkem Laboratories
21,855
1,828
2,257
23.5
more products in USA, which bodes for its international
business.
We expect the company would report strong profitability
Asian Granito
1,035
344
405
17.8
owing to better product mix, higher B2C sales and
amalgamation synergy..
Favourable outlook for the AC industry to augur well for
Cooling products business which is out pacing the market
Blue Star
6,157
644
760
18.0
growth. EMPPAC division's profitability to improve once
operating environment turns around..
With a focus on the low and medium income (LMI)
consumer segment, the company has increased its
Dewan Housing Finance
12,706
406
520
28.2
presence in tier-II & III cities where the growth opportunity
is immense.
Strong loan growth backed by diversified loan portfolio
and adequate CAR. ROE & ROA likely to remain decent
Equitas Holdings
5,144
152
235
54.4
as risk of dilution remains low. Attractive valuations
considering growth.
Economic recovery to have favourable impact on
advertising & circulation revenue growth. Further, the
Jagran Prakashan
5,808
178
225
26.6
acquisition of a radio business (Radio City) would also
boost the company's revenue growth.
High order book execution in EPC segment, rising B2C
KEI Industries
1,566
201
239
18.5
sales and higher exports to boost the revenues and
profitability
Speedier execution and speedier sales, strong revenue
Mahindra Lifespace
2,191
427
522
22.3
visibilty in short-to-long run, attractive valuations
Massive capacity expansion along with rail advantage at
Navkar Corporation
2,943
206
265
28.4
ICD as well CFS augurs well for the company
Strong brands and distribution network would boost
Siyaram Silk Mills
1,673
1,785
1,872
4.9
growth going ahead. Stock currently trades at an
inexpensive valuation.
Market leadership in Hindi news genre and no.
2
viewership ranking in English news genre, exit from the
TV Today Network
1,517
254
344
35.2
radio business, and anticipated growth in ad spends by
corporates to benefit the stock.
Source: Company, Angel Research
Market Outlook
May 26, 2017
Key Upcoming Events
Result Calendar
Date
Company
May 26, 2017
Tata Chemicals, Crompton Greaves, Power Fin.Corpn., ITC, Tech Mahindra, Styrolution, Sterling Tools, Sun Pharma,
Divi's Lab., Indoco Remedies, DLF
May 27, 2017
India Cements, Canara Bank, Siyaram Silk Mills, Adani Power, PTC India
May 28, 2017
Ipca labs
May 29, 2017
BHEL, Jagran Prakashan, Coal India, Bajaj Electrical, Cravatex, Aurobindo Pharma, NTPC
Source: Bloomberg, Angel Research
Global economic events release calendar
Bloomberg Data
Date
Time
Country
Event Description
Unit
Period
Last Reported
Estimated
May 26, 2017
2:30 PMEuro Zone Euro-Zone Consumer Confidence
Value
May F
(3.30)
May 30, 2017
6:00 PMUS
GDP Qoq (Annualised)
% Change
1Q S
0.70
0.90
7:30 PMUS
Consumer Confidence
S.A./ 1985=100 May
120.30
119.90
May 31, 2017
1:25 PMGermany PMI Manufacturing
Value
May F
59.40
1:25 PMGermany Unemployment change (000's)
Thousands
May
(15.00)
Jun 01, 2017
6:30 AMChina
PMI Manufacturing
Value
May
51.20
51.00
2:00 PMUK
PMI Manufacturing
Value
May
57.30
Jun 02, 2017
6:00 PMUS
Change in Nonfarm payrolls
Thousands
May
211.00
178.00
6:00 PMUS
Unnemployment rate
%
May
4.40
4.40
Jun 06, 2017
1:25 PMGermany PMI Services
Value
May F
55.20
Jun 07, 2017
2:30 PMEuro Zone Euro-Zone GDP s.a. (QoQ)
% Change
1Q F
0.50
2:30 PMIndia
RBI Reverse Repo rate
%
Jun 7
6.00
2:30 PMIndia
RBI Repo rate
%
Jun 7
6.25
2:30 PMIndia
RBI Cash Reserve ratio
%
Jun 7
4.00
Jun 08, 2017
China
Exports YoY%
% Change
May
8.00
Source: Bloomberg, Angel Research
Market Outlook
May 26, 2017
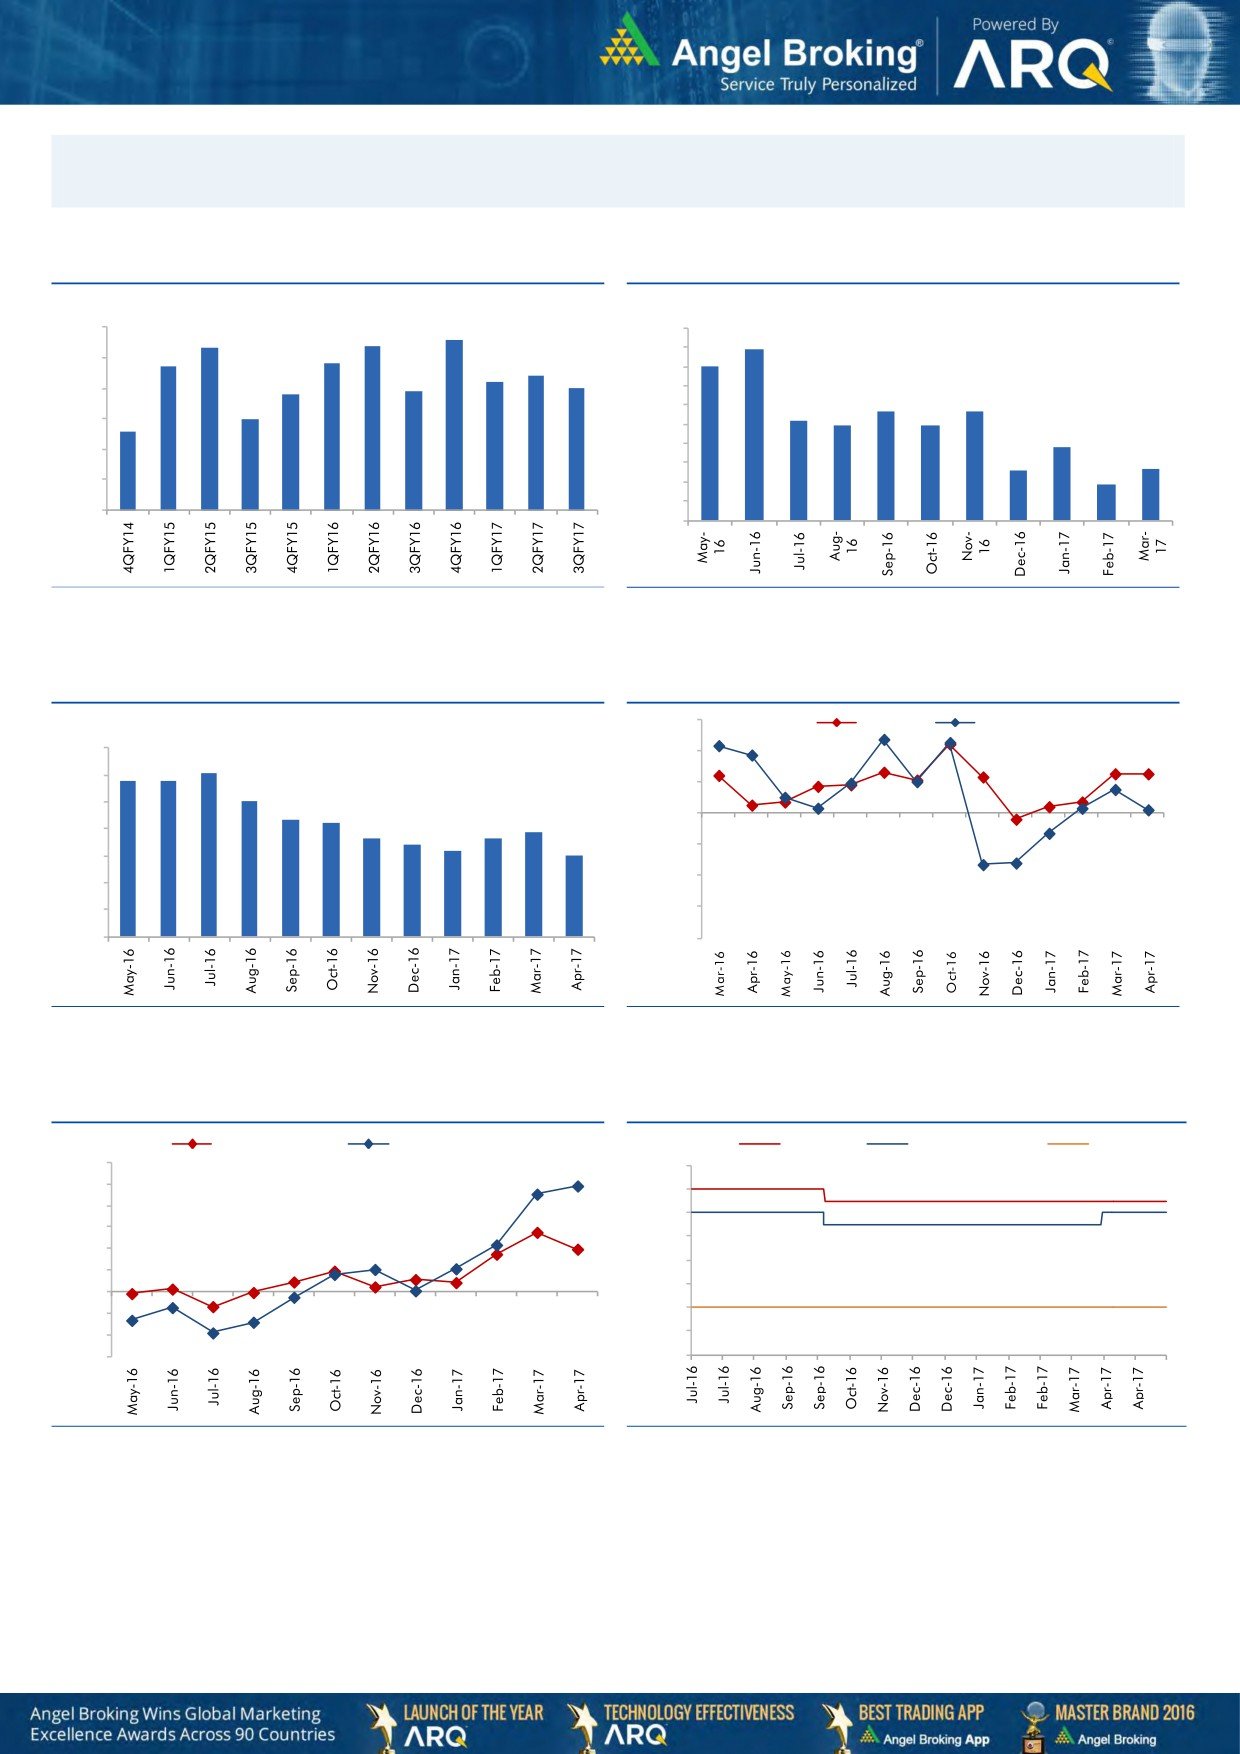
Macro watch
Exhibit 1: Quarterly GDP trends
Exhibit 2: IIP trends
(%)
(%)
8.6
9.0
8.3
8.4
10.0
8.9
7.7
7.8
9.0
8.0
8.0
7.4
7.2
8.0
6.9
7.0
6.8
7.0
7.0
5.7
5.7
6.0
6.0
5.2
4.9
4.9
6.0
5.6
5.0
3.8
4.0
5.0
2.6
2.7
3.0
1.9
4.0
2.0
1.0
3.0
-
Source: CSO, Angel Research
Source: MOSPI, Angel Research
Exhibit 3: Monthly CPI inflation trends
Exhibit 4: Manufacturing and services PMI
56.0
Mfg. PMI
Services PMI
(%)
7.0
54.0
6.1
5.8
5.8
6.0
5.1
52.0
5.0
4.3
4.2
3.9
50.0
3.6
3.7
4.0
3.4
3.2
3.0
48.0
3.0
46.0
2.0
1.0
44.0
-
42.0
Source: MOSPI, Angel Research
Source: Market, Angel Research; Note: Level above 50 indicates expansion
Exhibit 5: Exports and imports growth trends
Exhibit 6: Key policy rates
(%)
Exports yoy growth
Imports yoy growth
(%)
Repo rate
Reverse Repo rate
CRR
60.0
7.00
50.0
6.50
40.0
6.00
30.0
5.50
20.0
5.00
10.0
4.50
0.0
4.00
(10.0)
(20.0)
3.50
(30.0)
3.00
Source: Bloomberg, Angel Research
Source: RBI, Angel Research
Market Outlook
May 26, 2017
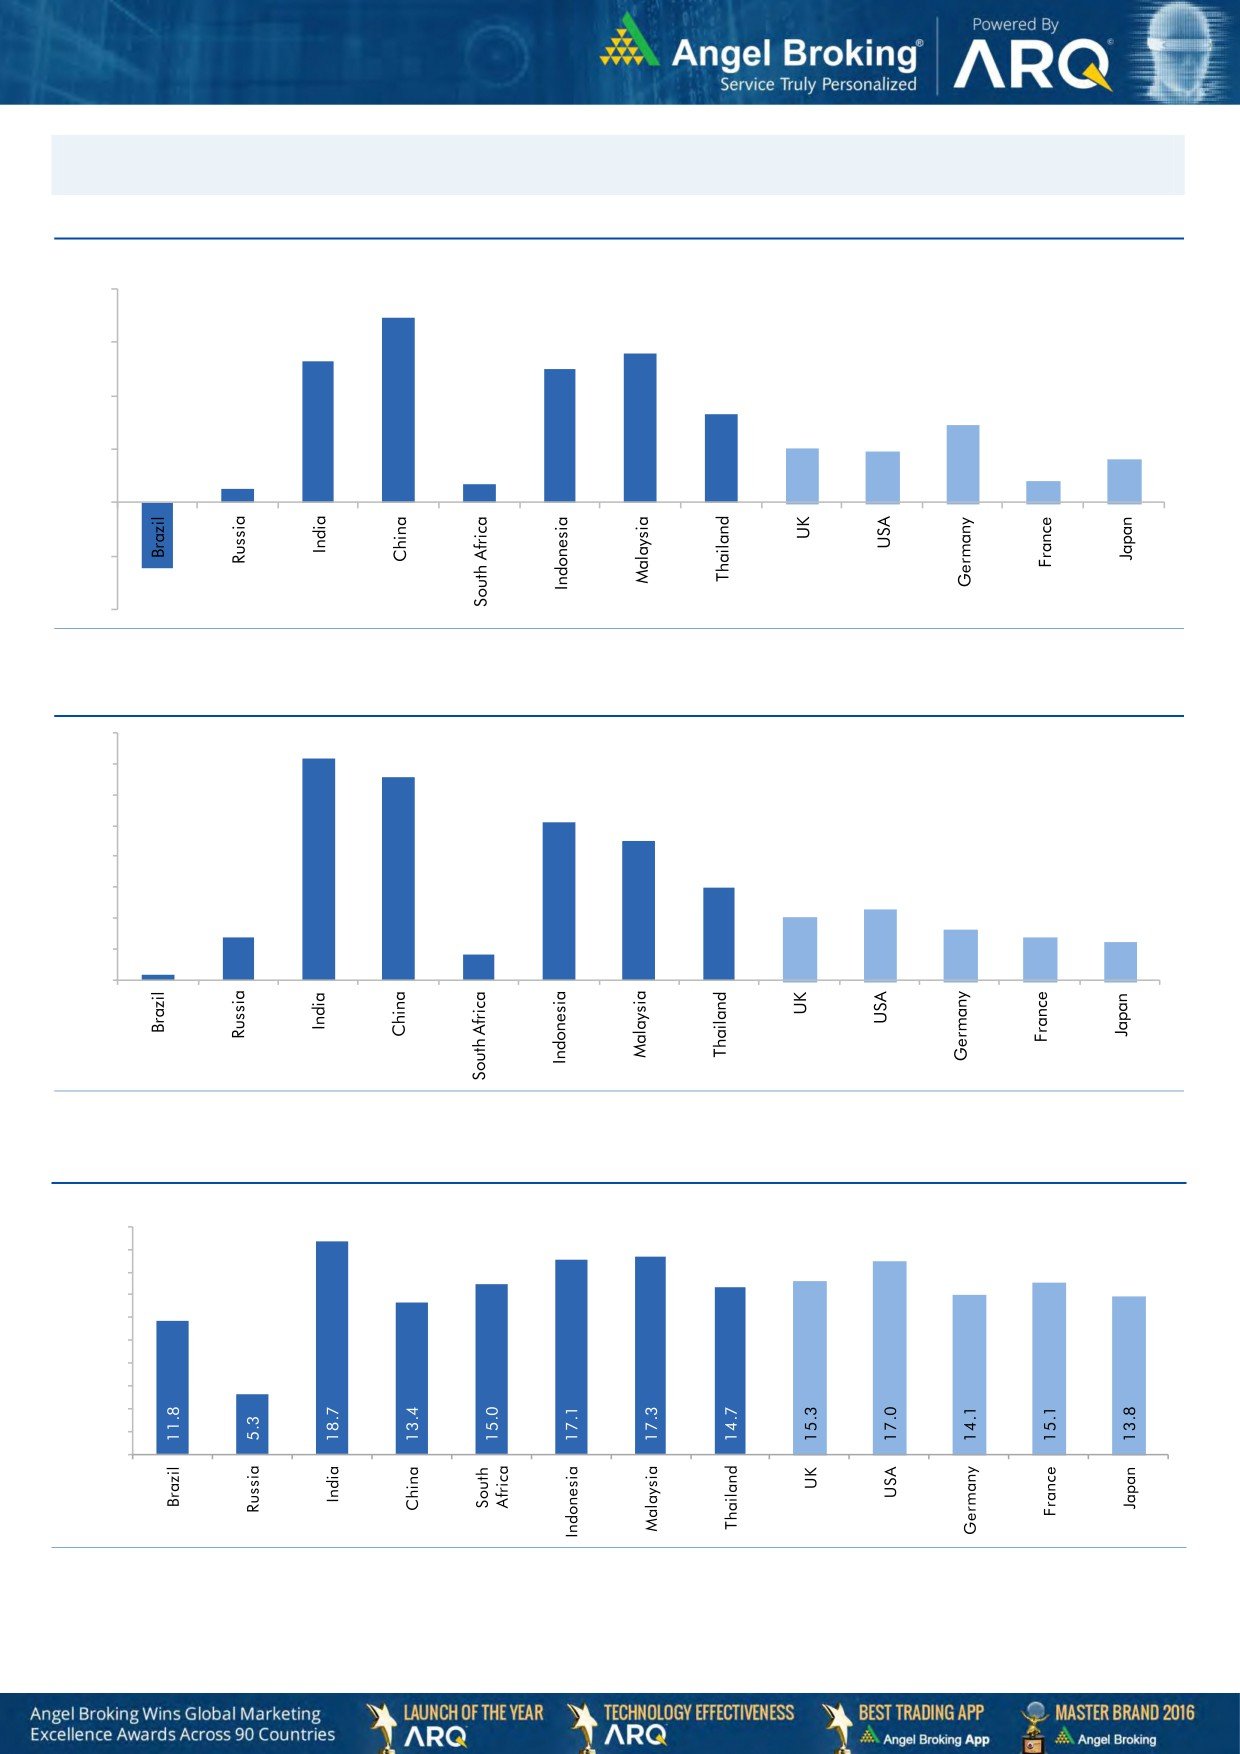
Global watch
Exhibit 1: Latest quarterly GDP Growth (%, yoy) across select developing and developed countries
(%)
8.0
6.9
5.6
6.0
5.3
5.0
0.7
4.0
3.3
2.9
2.0
1.9
0.5
2.0
1.6
0.8
-
(2.0)
(2.5)
(4.0)
Source: Bloomberg, Angel Research
Exhibit 2: 2016 GDP Growth projection by IMF (%, yoy) across select developing and developed countries
(%)
7.2
7.0
6.6
6.0
5.1
5.0
4.5
4.0
3.0
3.0
2.3
2.0
1.4
1.6
2.0
1.4
1.2
0.2
0.8
1.0
-
Source: IMF, Angel Research
Exhibit 3: One year forward P-E ratio across select developing and developed countries
(x)
20.0
18.0
16.0
14.0
12.0
10.0
8.0
6.0
4.0
2.0
-
Source: IMF, Angel Research
Market Outlook
May 26, 2017
Exhibit 4: Relative performance of indices across globe
Returns (%)
Country
Name of index
Closing price
1M
3M
1YR
Brazil
Bovespa
63,227
(1.8)
(6.7)
28.2
Russia
Micex
1,947
0.8
(8.5)
1.0
India
Nifty
9,510
3.2
7.8
22.7
China
Shanghai Composite
3,108
(0.5)
(4.4)
9.4
South Africa
Top 40
47,572
4.6
5.5
2.2
Mexico
Mexbol
49,411
(0.0)
4.9
7.3
Indonesia
LQ45
953
3.7
7.0
18.3
Malaysia
KLCI
1,774
1.0
3.9
8.5
Thailand
SET 50
992
(0.3)
0.4
10.3
USA
Dow Jones
21,083
0.4
1.3
18.3
UK
FTSE
7,518
3.5
3.3
19.9
Japan
Nikkei
19,813
7.5
2.9
19.0
Germany
DAX
12,622
1.3
5.5
23.7
France
CAC
5,337
1.3
9.2
19.5
Source: Bloomberg, Angel Research
Stock Watch
May 26, 2017
Company Name
Reco
CMP
Target
Mkt Cap
Sales ( Čcr )
OPM(%)
EPS (Č)
PER(x)
P/BV(x)
RoE(%)
EV/Sales(x)
(Č)
Price ( Č)
( Č cr )
FY17E FY18E
FY17E
FY18E
FY17E
FY18E
FY17E
FY18E
FY17E
FY18E
FY17E
FY18E
FY17E
FY18E
Agri / Agri Chemical
Rallis
Neutral
238
-
4,634
1,937
2,164
13.3
14.3
9.0
11.0
26.5
21.7
4.6
4.0
18.4
19.8
2.4
2.1
United Phosphorus
Neutral
812
-
41,227
15,176
17,604
18.5
18.5
37.4
44.6
21.7
18.2
4.3
3.5
21.4
21.2
2.8
2.4
Auto & Auto Ancillary
Ashok Leyland
Buy
86
111
24,489
20,021
21,915
11.6
11.9
4.5
5.3
19.1
16.2
3.9
3.5
20.6
21.5
1.2
1.0
Bajaj Auto
Neutral
2,822
-
81,648
25,093
27,891
19.5
19.2
143.9
162.5
19.6
17.4
5.5
4.7
30.3
29.4
3.0
2.6
Bharat Forge
Neutral
1,110
-
25,843
7,726
8,713
20.5
21.2
35.3
42.7
31.5
26.0
5.8
5.3
18.9
20.1
3.4
3.0
Eicher Motors
Neutral
27,954
-
76,064
16,583
20,447
17.5
18.0
598.0
745.2
46.8
37.5
16.0
12.2
41.2
38.3
4.4
3.5
Gabriel India
Neutral
129
-
1,852
1,544
1,715
9.0
9.3
5.4
6.3
23.9
20.5
4.5
4.0
18.9
19.5
1.2
1.0
Hero Motocorp
Neutral
3,616
-
72,205
28,083
30,096
15.3
15.7
171.8
187.0
21.0
19.3
7.3
6.2
30.1
27.9
2.4
2.2
Jamna Auto Industries Neutral
231
-
1,841
1,486
1,620
9.8
9.9
15.0
17.2
15.4
13.4
3.4
2.9
21.8
21.3
1.3
1.2
L G Balakrishnan & Bros Neutral
697
-
1,094
1,302
1,432
11.6
11.9
43.7
53.0
16.0
13.2
2.3
2.0
13.8
14.2
0.9
0.8
Mahindra and Mahindra Neutral
1,326
-
82,366
46,534
53,077
11.6
11.7
67.3
78.1
19.7
17.0
3.2
2.8
15.4
15.8
1.7
1.5
Maruti
Neutral
6,983
-
210,933
67,822
83,288
16.0
16.4
253.8
312.4
27.5
22.4
6.3
5.1
23.0
22.9
2.8
2.2
Minda Industries
Neutral
569
-
4,916
2,728
3,042
9.0
9.1
68.2
86.2
8.3
6.6
1.9
1.5
23.8
24.3
1.9
1.6
Motherson Sumi
Neutral
432
-
60,592
45,896
53,687
7.8
8.3
13.0
16.1
33.1
26.8
10.7
8.5
34.7
35.4
1.4
1.2
Rane Brake Lining
Neutral
1,085
-
859
511
562
11.3
11.5
28.1
30.9
38.6
35.1
5.9
5.4
15.3
15.0
1.8
1.7
Setco Automotive
Neutral
39
-
520
741
837
13.0
13.0
15.2
17.0
2.6
2.3
0.4
0.4
15.8
16.3
1.1
1.0
Tata Motors
Neutral
475
-
137,279
300,209
338,549
8.9
8.4
42.7
54.3
11.1
8.8
1.8
1.5
15.6
17.2
0.6
0.5
TVS Motor
Neutral
542
-
25,747
13,390
15,948
6.9
7.1
12.8
16.5
42.5
32.8
10.6
8.4
26.3
27.2
2.0
1.6
Amara Raja Batteries
Buy
837
1,009
14,305
5,305
6,100
16.0
16.3
28.4
34.0
29.5
24.6
5.7
4.8
19.3
19.3
2.7
2.3
Exide Industries
Neutral
228
-
19,380
7,439
8,307
15.0
15.0
8.1
9.3
28.2
24.5
3.9
3.5
14.3
16.7
2.2
2.0
Apollo Tyres
Neutral
228
-
11,580
12,877
14,504
14.3
13.9
21.4
23.0
10.6
9.9
1.7
1.4
16.4
15.2
1.1
1.0
Ceat
Neutral
1,669
-
6,752
7,524
8,624
13.0
12.7
131.1
144.3
12.7
11.6
2.3
2.0
19.8
18.6
1.0
0.9
JK Tyres
Neutral
170
-
3,862
7,455
8,056
15.0
15.0
21.8
24.5
7.8
7.0
1.6
1.3
22.8
21.3
0.6
0.6
Swaraj Engines
Neutral
1,830
-
2,273
660
810
15.2
16.4
54.5
72.8
33.6
25.1
10.5
9.5
31.5
39.2
3.3
2.6
Subros
Neutral
242
-
1,449
1,488
1,681
11.7
11.9
6.4
7.2
37.7
33.7
4.0
3.6
10.8
11.4
1.2
1.0
Indag Rubber
Neutral
204
-
534
286
326
19.8
16.8
11.7
13.3
17.4
15.3
2.9
2.8
17.8
17.1
1.5
1.3
Capital Goods
ACE
Neutral
61
-
607
709
814
4.1
4.6
1.4
2.1
43.8
29.2
1.8
1.7
4.4
6.0
1.0
0.9
BEML
Neutral
1,175
-
4,893
3,451
4,055
6.3
9.2
31.4
57.9
37.4
20.3
2.3
2.0
6.3
10.9
1.5
1.3
Bharat Electronics
Neutral
172
-
38,418
8,137
9,169
16.8
17.2
58.7
62.5
2.9
2.8
0.5
0.4
44.6
46.3
3.7
3.3
Stock Watch
May 26, 2017
Company Name
Reco
CMP
Target
Mkt Cap
Sales ( Čcr )
OPM(%)
EPS (Č)
PER(x)
P/BV(x)
RoE(%)
EV/Sales(x)
(Č)
Price ( Č)
( Č cr )
FY17E
FY18E
FY17E
FY18E
FY17E
FY18E
FY17E
FY18E
FY17E
FY18E
FY17E
FY18E
FY17E
FY18E
Capital Goods
Voltas
Neutral
476
-
15,734
6,511
7,514
7.9
8.7
12.9
16.3
36.9
29.2
6.6
5.8
16.7
18.5
2.2
1.8
BGR Energy
Neutral
157
-
1,134
16,567
33,848
6.0
5.6
7.8
5.9
20.2
26.6
1.2
1.1
4.7
4.2
0.2
0.1
BHEL
Neutral
152
-
37,106
28,797
34,742
-
2.8
2.3
6.9
65.9
22.0
1.1
1.1
1.3
4.8
0.9
0.7
Blue Star
Buy
644
760
6,157
4,283
5,077
5.9
7.3
14.9
22.1
43.3
29.1
8.4
7.1
20.4
26.4
1.5
1.2
CG Power and Industrial
Neutral
93
-
5,829
5,777
6,120
5.9
7.0
3.3
4.5
28.2
20.7
1.2
1.2
4.4
5.9
1.0
0.8
Solutions
Greaves Cotton
Neutral
152
-
3,710
1,755
1,881
16.8
16.9
7.8
8.5
19.5
17.9
3.9
3.6
20.6
20.9
1.8
1.6
Inox Wind
Neutral
136
-
3,010
5,605
6,267
15.7
16.4
24.8
30.0
5.5
4.5
1.5
1.1
25.9
24.4
0.6
0.5
KEC International
Neutral
252
-
6,484
9,294
10,186
7.9
8.1
9.9
11.9
25.5
21.2
3.7
3.2
15.6
16.3
0.9
0.8
KEI Industries
Buy
201
239
1,566
2,682
3,058
10.4
10.0
11.7
12.8
17.2
15.7
3.4
2.9
20.1
18.2
0.8
0.7
Thermax
Neutral
990
-
11,801
5,421
5,940
7.3
7.3
25.7
30.2
38.5
32.8
4.7
4.3
12.2
13.1
2.1
1.9
VATech Wabag
Neutral
683
-
3,728
3,136
3,845
8.9
9.1
26.0
35.9
26.3
19.0
3.3
2.8
13.4
15.9
1.1
0.9
Cement
ACC
Neutral
1,614
-
30,316
11,225
13,172
13.2
16.9
44.5
75.5
36.3
21.4
3.4
3.2
11.2
14.2
2.7
2.3
Ambuja Cements
Neutral
240
-
47,596
9,350
10,979
18.2
22.5
5.8
9.5
41.3
25.2
3.5
3.1
10.2
12.5
5.1
4.3
India Cements
Neutral
197
-
6,061
4,364
4,997
18.5
19.2
7.9
11.3
25.0
17.5
1.8
1.8
8.0
8.5
2.1
1.9
JK Cement
Neutral
1,095
-
7,655
4,398
5,173
15.5
17.5
31.2
55.5
35.1
19.7
4.2
3.7
12.0
15.5
2.3
1.9
J K Lakshmi Cement
Neutral
477
-
5,607
2,913
3,412
14.5
19.5
7.5
22.5
63.5
21.2
3.9
3.3
12.5
18.0
2.5
2.1
Orient Cement
Neutral
150
-
3,072
2,114
2,558
18.5
20.5
8.1
11.3
18.5
13.3
2.7
2.3
9.0
14.0
2.1
1.6
UltraTech Cement
Neutral
4,164
-
114,307
25,768
30,385
21.0
23.5
111.0
160.0
37.5
26.0
4.8
4.2
13.5
15.8
4.5
3.8
Construction
ITNL
Neutral
103
-
3,380
8,946
10,017
31.0
31.6
8.1
9.1
12.7
11.3
0.5
0.5
4.2
5.0
3.7
3.4
KNR Constructions
Neutral
198
-
2,786
1,385
1,673
14.7
14.0
41.2
48.5
4.8
4.1
0.9
0.8
14.9
15.2
2.1
1.7
Larsen & Toubro
Neutral
1,769
-
165,068
111,017
124,908
11.0
11.0
61.1
66.7
29.0
26.5
3.5
3.2
13.1
12.9
2.5
2.3
Gujarat Pipavav Port
Neutral
148
-
7,143
705
788
52.2
51.7
5.0
5.6
29.6
26.4
2.9
2.6
11.2
11.2
9.8
8.3
Nagarjuna Const.
Neutral
86
-
4,770
8,842
9,775
9.1
8.8
5.3
6.4
16.2
13.4
1.3
1.2
8.2
9.1
0.7
0.6
PNC Infratech
Neutral
141
-
3,607
2,350
2,904
13.1
13.2
9.0
8.8
15.6
16.0
0.6
0.5
15.9
13.9
1.7
1.3
Simplex Infra
Neutral
415
-
2,051
6,829
7,954
10.5
10.5
31.4
37.4
13.2
11.1
1.4
1.3
9.9
13.4
0.7
0.6
Power Mech Projects
Neutral
587
-
863
1,801
2,219
12.7
14.6
72.1
113.9
8.1
5.2
1.5
1.3
16.8
11.9
0.5
0.4
Sadbhav Engineering
Neutral
313
-
5,377
3,598
4,140
10.3
10.6
9.0
11.9
34.8
26.3
3.6
3.2
9.9
11.9
1.8
1.5
NBCC
Neutral
187
-
16,826
7,428
9,549
7.9
8.6
8.2
11.0
22.8
17.0
1.1
0.9
28.2
28.7
2.0
1.5
MEP Infra
Neutral
67
-
1,092
1,877
1,943
30.6
29.8
3.0
4.2
22.4
16.0
10.8
7.3
0.6
0.6
2.0
1.8
Stock Watch
May 26, 2017
Company Name
Reco
CMP
Target
Mkt Cap
Sales ( Čcr )
OPM(%)
EPS (Č)
PER(x)
P/BV(x)
RoE(%)
EV/Sales(x)
(Č)
Price ( Č)
( Č cr )
FY17E
FY18E
FY17E
FY18E
FY17E
FY18E
FY17E
FY18E
FY17E
FY18E
FY17E
FY18E
FY17E
FY18E
Construction
SIPL
Neutral
102
-
3,586
1,036
1,252
65.5
66.2
(8.4)
(5.6)
3.8
4.4
(22.8)
(15.9)
11.7
9.7
Engineers India
Neutral
155
-
10,411
1,725
1,935
16.0
19.1
11.4
13.9
13.6
11.1
1.9
1.8
13.4
15.3
5.0
4.4
Financials
Axis Bank
Accumulate
506
580
121,352
46,932
53,575
3.5
3.4
32.4
44.6
15.7
11.3
2.0
1.8
13.6
16.5
-
-
Bank of Baroda
Neutral
181
-
41,763
19,980
23,178
1.8
1.8
11.5
17.3
15.8
10.5
1.8
1.5
8.3
10.1
-
-
Canara Bank
Neutral
358
-
21,410
15,225
16,836
1.8
1.8
14.5
28.0
24.7
12.8
1.7
1.4
5.8
8.5
-
-
Can Fin Homes
Neutral
2,641
-
7,031
420
526
3.5
3.5
86.5
107.8
30.5
24.5
6.6
5.4
23.6
24.1
-
-
Cholamandalam Inv. &
Buy
992
1,230
15,510
2,012
2,317
6.3
6.3
42.7
53.6
23.2
18.5
3.7
3.2
16.9
18.3
-
-
Fin. Co.
Dewan Housing Finance Buy
406
520
12,706
2,225
2,688
2.9
2.9
29.7
34.6
13.7
11.7
2.2
1.4
16.1
14.8
-
-
Equitas Holdings
Buy
152
235
5,144
939
1,281
11.7
11.5
5.8
8.2
26.2
18.6
2.3
2.0
10.9
11.5
-
-
Federal Bank
Accumulate
111
125
19,088
8,259
8,995
3.0
3.0
4.3
5.6
25.7
19.8
2.2
2.0
8.5
10.1
-
-
HDFC
Neutral
1,538
-
244,440
11,475
13,450
3.4
3.4
45.3
52.5
34.0
29.3
6.6
5.8
20.2
20.5
-
-
HDFC Bank
Neutral
1,617
-
414,784
46,097
55,433
4.5
4.5
58.4
68.0
27.7
23.8
4.9
4.1
18.8
18.6
-
-
ICICI Bank
Neutral
318
-
185,065
42,800
44,686
3.1
3.3
18.0
21.9
17.6
14.5
2.4
2.2
11.1
12.3
-
-
Karur Vysya Bank
Buy
117
140
7,089
5,640
6,030
3.3
3.2
8.9
10.0
13.2
11.7
1.4
1.3
11.2
11.4
-
-
Lakshmi Vilas Bank
Neutral
184
-
3,522
3,339
3,799
2.7
2.8
11.0
14.0
16.7
13.1
1.7
1.6
11.2
12.7
-
-
LIC Housing Finance
Neutral
688
-
34,718
3,712
4,293
2.6
2.5
39.0
46.0
17.6
15.0
3.3
2.8
19.9
20.1
-
-
Punjab Natl.Bank
Neutral
151
-
32,026
23,532
23,595
2.3
2.4
6.8
12.6
22.1
11.9
3.4
2.4
3.3
6.5
-
-
RBL Bank
Neutral
546
-
20,505
1,783
2,309
2.6
2.6
12.7
16.4
43.0
33.3
4.7
4.2
12.8
13.3
-
-
Repco Home Finance
Accumulate
749
825
4,686
388
457
4.5
4.2
30.0
38.0
25.0
19.7
4.2
3.5
18.0
19.2
-
-
South Ind.Bank
Neutral
26
-
4,653
6,435
7,578
2.5
2.5
2.7
3.1
9.6
8.3
1.2
1.0
10.1
11.2
-
-
St Bk of India
Neutral
290
-
235,186
88,650
98,335
2.6
2.6
13.5
18.8
21.5
15.4
2.0
1.8
7.0
8.5
-
-
Union Bank
Neutral
165
-
11,315
13,450
14,925
2.3
2.3
25.5
34.5
6.5
4.8
0.9
0.8
7.5
10.2
-
-
Yes Bank
Neutral
1,463
-
66,876
8,978
11,281
3.3
3.4
74.0
90.0
19.8
16.3
3.8
3.2
17.0
17.2
-
-
FMCG
Akzo Nobel India
Neutral
1,810
-
8,681
2,955
3,309
13.3
13.7
57.2
69.3
31.7
26.1
10.3
8.7
32.7
33.3
2.7
2.4
Asian Paints
Neutral
1,112
-
106,696
17,128
18,978
16.8
16.4
19.1
20.7
58.2
53.7
20.3
19.1
34.8
35.5
6.1
5.5
Britannia
Neutral
3,515
-
42,175
9,594
11,011
14.6
14.9
80.3
94.0
43.8
37.4
18.0
13.9
41.2
-
4.3
3.7
Colgate
Neutral
983
-
26,727
4,605
5,149
23.4
23.4
23.8
26.9
41.3
36.5
22.9
17.9
64.8
66.8
5.7
5.1
Dabur India
Accumulate
270
304
47,517
8,315
9,405
19.8
20.7
8.1
9.2
33.3
29.3
9.3
7.7
31.6
31.0
5.4
4.7
GlaxoSmith Con*
Neutral
5,237
-
22,026
4,350
4,823
21.2
21.4
179.2
196.5
29.2
26.7
7.8
6.6
27.1
26.8
4.4
3.9
Stock Watch
May 26, 2017
Company Name
Reco
CMP
Target
Mkt Cap
Sales ( Čcr )
OPM(%)
EPS (Č)
PER(x)
P/BV(x)
RoE(%)
EV/Sales(x)
(Č)
Price ( Č)
( Č cr )
FY17E FY18E
FY17E
FY18E
FY17E
FY18E
FY17E
FY18E
FY17E
FY18E
FY17E
FY18E
FY17E
FY18E
FMCG
Godrej Consumer
Neutral
1,793
-
61,068
10,235
11,428
18.4
18.6
41.1
44.2
43.6
40.6
9.7
8.2
24.9
24.8
6.1
5.4
HUL
Neutral
1,043
-
225,785
35,252
38,495
17.8
17.8
20.7
22.4
50.5
46.6
48.3
41.4
95.6
88.9
6.2
5.7
ITC
Neutral
300
-
364,057
40,059
44,439
38.3
39.2
9.0
10.1
33.4
29.6
9.3
8.1
27.8
27.5
8.6
7.7
Marico
Neutral
315
-
40,669
6,430
7,349
18.8
19.5
6.4
7.7
49.2
40.9
14.9
12.5
33.2
32.5
6.1
5.3
Nestle*
Neutral
6,506
-
62,727
10,073
11,807
20.7
21.5
124.8
154.2
52.1
42.2
21.4
19.3
34.8
36.7
6.0
5.1
Tata Global
Neutral
143
-
9,028
8,675
9,088
9.8
9.8
7.4
8.2
19.3
17.5
1.5
1.5
7.9
8.1
1.0
0.9
Procter & Gamble
Neutral
7,440
-
24,151
2,939
3,342
23.2
23.0
146.2
163.7
50.9
45.5
12.9
10.7
25.3
23.5
7.8
6.8
Hygiene
IT
HCL Tech^
Buy
859
1,014
122,550
46,723
52,342
22.1
20.9
60.0
62.8
14.3
13.7
3.6
3.1
25.3
22.4
2.4
2.0
Infosys
Buy
982
1,179
225,537
68,484
73,963
26.0
26.0
63.0
64.0
15.6
15.3
3.3
3.0
20.8
19.7
3.0
2.6
TCS
Neutral
2,620
-
516,242
117,966
127,403
27.5
27.6
134.3
144.5
19.5
18.1
5.8
5.4
29.8
29.7
4.0
3.7
Tech Mahindra
Buy
427
600
41,579
29,673
32,937
15.5
17.0
32.8
39.9
13.0
10.7
2.6
2.2
19.6
20.7
1.1
1.0
Wipro
Accumulate
535
570
130,131
55,421
58,536
20.3
20.3
35.1
36.5
15.2
14.7
2.6
2.3
19.2
14.6
1.8
1.5
Media
D B Corp
Neutral
362
-
6,654
2,297
2,590
27.4
28.2
21.0
23.4
17.2
15.5
4.0
3.5
23.7
23.1
2.7
2.3
HT Media
Neutral
81
-
1,885
2,693
2,991
12.6
12.9
7.9
9.0
10.3
9.0
0.9
0.8
7.8
8.3
0.3
0.2
Jagran Prakashan
Buy
178
225
5,808
2,355
2,635
28.0
28.0
10.8
12.5
16.5
14.2
3.6
3.1
21.7
21.7
2.5
2.2
Sun TV Network
Neutral
795
-
31,318
2,850
3,265
70.1
71.0
26.2
30.4
30.3
26.1
7.8
6.9
24.3
25.6
10.6
9.1
Hindustan Media
Neutral
278
-
2,040
1,016
1,138
24.3
25.2
27.3
30.1
10.2
9.2
1.9
1.7
16.2
15.8
1.3
1.2
Ventures
TV Today Network
Buy
254
344
1,517
567
645
26.7
27.0
15.4
18.1
16.6
14.1
2.5
2.1
14.9
15.2
2.2
1.9
Metals & Mining
Coal India
Neutral
266
-
165,086
84,638
94,297
21.4
22.3
24.5
27.1
10.9
9.8
4.5
4.3
42.6
46.0
1.5
1.3
Hind. Zinc
Neutral
235
-
99,126
14,252
18,465
55.9
48.3
15.8
21.5
14.9
10.9
2.4
2.1
17.0
20.7
7.0
5.4
Hindalco
Neutral
190
-
42,534
107,899
112,095
7.4
8.2
9.2
13.0
20.6
14.6
1.0
0.9
4.8
6.6
0.9
0.9
JSW Steel
Neutral
193
-
46,592
53,201
58,779
16.1
16.2
130.6
153.7
1.5
1.3
0.2
0.2
14.0
14.4
1.6
1.4
NMDC
Neutral
118
-
37,176
6,643
7,284
44.4
47.7
7.1
7.7
16.6
15.3
1.4
1.4
8.8
9.2
3.4
3.0
SAIL
Neutral
57
-
23,562
47,528
53,738
(0.7)
2.1
(1.9)
2.6
21.9
0.6
0.6
(1.6)
3.9
1.3
1.2
Vedanta
Neutral
233
-
86,462
71,744
81,944
19.2
21.7
13.4
20.1
17.4
11.6
1.5
1.3
8.4
11.3
1.6
1.3
Tata Steel
Neutral
485
-
47,133
121,374
121,856
7.2
8.4
18.6
34.3
26.1
14.2
1.6
1.5
6.1
10.1
1.0
1.0
Oil & Gas
GAIL
Neutral
401
-
67,889
56,220
65,198
9.3
10.1
27.1
33.3
14.8
12.1
1.4
1.3
9.3
10.7
1.4
1.2
ONGC
Neutral
174
-
223,491
137,222
152,563
15.0
21.8
19.5
24.1
8.9
7.2
0.8
0.7
8.5
10.1
1.9
1.7
Indian Oil Corp
Neutral
439
-
213,029
373,359
428,656
5.9
5.5
54.0
59.3
8.1
7.4
1.3
1.1
16.0
15.6
0.7
0.6
Stock Watch
May 26, 2017
Company Name
Reco
CMP
Target
Mkt Cap
Sales ( Čcr )
OPM(%)
EPS (Č)
PER(x)
P/BV(x)
RoE(%)
EV/Sales(x)
(Č)
Price ( Č)
( Č cr )
FY17E FY18E
FY17E
FY18E
FY17E
FY18E
FY17E
FY18E
FY17E
FY18E
FY17E
FY18E
FY17E
FY18E
Oil & Gas
Reliance Industries
Neutral
1,303
-
423,629
301,963
358,039
12.1
12.6
87.7
101.7
14.9
12.8
1.5
1.4
10.7
11.3
1.9
1.6
Pharmaceuticals
Alembic Pharma
Accumulate
571
648
10,763
3,101
3,966
19.7
20.5
21.4
25.5
26.7
22.4
5.7
4.6
23.0
22.8
3.4
2.5
Alkem Laboratories Ltd
Buy
1,828
2,257
21,855
6,065
7,009
18.7
20.0
80.2
92.0
22.8
19.9
5.1
4.3
22.5
21.6
3.6
3.1
Aurobindo Pharma
Buy
526
877
30,809
15,720
18,078
23.7
23.7
41.4
47.3
12.7
11.1
3.3
2.6
29.6
26.1
2.2
1.9
Aventis*
Neutral
4,057
-
9,344
2,206
2,508
16.6
16.8
128.9
139.9
31.5
29.0
5.4
4.2
21.6
23.5
4.0
3.3
Cadila Healthcare
Neutral
427
-
43,693
10,429
12,318
17.7
21.6
13.1
19.2
32.6
22.2
6.8
5.4
22.8
27.1
4.2
3.5
Cipla
Reduce
504
465
40,557
15,378
18,089
15.7
16.8
19.3
24.5
26.1
20.6
3.1
2.7
12.3
13.9
2.8
2.3
Dr Reddy's
Neutral
2,427
-
40,214
14,081
15,937
16.1
18.6
72.6
105.9
33.4
22.9
3.3
3.0
9.6
13.6
3.1
2.7
Dishman Pharma
Sell
268
143
4,331
1,718
1,890
22.7
22.8
9.5
11.3
28.3
23.8
2.7
2.5
10.1
10.9
3.0
2.6
GSK Pharma*
Neutral
2,369
-
20,064
2,927
3,290
11.8
16.2
34.4
49.6
68.9
47.8
10.0
10.4
13.9
21.3
6.6
6.0
Indoco Remedies
Buy
192
240
1,769
1,112
1,289
16.2
18.2
11.6
16.0
16.6
12.0
2.6
2.2
17.0
20.1
1.7
1.4
Ipca labs
Buy
488
613
6,158
3,258
3,747
12.8
15.3
12.1
19.2
40.3
25.4
2.5
2.3
6.4
9.5
2.0
1.8
Lupin
Buy
1,138
1,809
51,398
15,912
18,644
26.4
26.7
58.1
69.3
19.6
16.4
3.8
3.1
21.4
20.9
3.3
2.7
Natco Pharma
Accumulate
892
974
15,548
2,090
2,335
32.1
26.6
26.8
23.2
33.2
38.5
9.4
8.1
28.4
21.1
7.5
92.1
Sun Pharma
Buy
592
847
141,986
31,129
35,258
32.0
32.9
30.2
35.3
19.6
16.8
3.2
2.6
20.0
20.1
4.1
3.5
Power
Tata Power
Neutral
80
-
21,733
36,916
39,557
17.4
27.1
5.1
6.3
15.8
12.8
1.4
1.3
9.0
10.3
1.6
1.4
NTPC
Neutral
156
-
128,918
86,605
95,545
17.5
20.8
11.8
13.4
13.3
11.7
1.3
1.3
10.5
11.1
2.8
2.8
Power Grid
Accumulate
199
223
103,952
25,315
29,193
88.2
88.7
14.2
17.2
14.0
11.6
2.1
1.9
15.2
16.1
8.8
7.9
Real Estate
Prestige Estate
Neutral
236
-
8,843
4,707
5,105
25.2
26.0
10.3
13.0
22.9
18.1
1.8
1.7
10.3
10.2
3.0
2.7
MLIFE
Buy
427
522
2,191
1,152
1,300
22.7
24.6
29.9
35.8
14.3
11.9
1.1
1.0
7.6
8.6
2.6
2.2
Telecom
Bharti Airtel
Neutral
370
-
147,724
105,086
114,808
34.5
34.7
12.2
16.4
30.3
22.5
2.1
1.9
6.8
8.4
2.3
2.0
Idea Cellular
Neutral
79
-
28,630
40,133
43,731
37.2
37.1
6.4
6.5
12.4
12.2
1.0
1.0
8.2
7.6
1.7
1.5
zOthers
Abbott India
Neutral
4,101
-
8,715
3,153
3,583
14.1
14.4
152.2
182.7
27.0
22.5
132.3
113.0
25.6
26.1
2.5
2.1
Asian Granito
Buy
344
405
1,035
1,060
1,169
12.2
12.5
12.7
15.9
27.2
21.6
2.6
2.3
9.5
10.7
1.3
1.1
Bajaj Electricals
Accumulate
346
395
3,500
4,801
5,351
5.7
6.2
10.4
13.7
33.2
25.3
4.1
3.7
12.4
14.5
0.7
0.7
Banco Products (India)
Neutral
217
-
1,551
1,353
1,471
12.3
12.4
14.5
16.3
15.0
13.3
20.7
18.6
14.5
14.6
1.1
116.7
Coffee Day Enterprises
Neutral
252
-
5,188
2,964
3,260
20.5
21.2
4.7
8.0
-
31.5
2.9
2.7
5.5
8.5
2.2
1.9
Ltd
Competent Automobiles Neutral
195
-
125
1,137
1,256
3.1
2.7
28.0
23.6
7.0
8.3
37.5
33.9
14.3
11.5
0.1
0.1
Elecon Engineering
Neutral
60
-
672
1,482
1,660
13.7
14.5
3.9
5.8
15.4
10.3
3.6
3.3
7.8
10.9
0.8
0.7
Stock Watch
May 26, 2017
Company Name
Reco
CMP
Target
Mkt Cap
Sales ( Čcr )
OPM(%)
EPS (Č)
PER(x)
P/BV(x)
RoE(%)
EV/Sales(x)
(Č)
Price ( Č)
( Č cr )
FY17E
FY18E
FY17E
FY18E
FY17E
FY18E
FY17E
FY18E
FY17E
FY18E
FY17E
FY18E
FY17E
FY18E
zOthers
Finolex Cables
Neutral
500
-
7,652
2,883
3,115
12.0
12.1
14.2
18.6
35.2
26.9
18.7
16.4
15.8
14.6
2.3
2.1
Garware Wall Ropes
Neutral
788
-
1,725
863
928
15.1
15.2
36.4
39.4
21.7
20.0
3.9
3.3
17.5
15.9
1.9
1.8
Goodyear India*
Neutral
827
-
1,908
1,598
1,704
10.4
10.2
49.4
52.6
16.8
15.7
77.3
67.8
18.2
17.0
0.9
124.5
Hitachi
Neutral
1,905
-
5,179
2,081
2,433
8.8
8.9
33.4
39.9
57.0
47.7
46.0
38.3
22.1
21.4
2.5
2.1
HSIL
Neutral
340
-
2,457
2,384
2,515
15.8
16.3
15.3
19.4
22.2
17.5
22.1
19.0
7.8
9.3
1.2
1.1
Interglobe Aviation
Neutral
1,072
-
38,753
21,122
26,005
14.5
27.6
110.7
132.1
9.7
8.1
58.0
41.4
168.5
201.1
1.8
1.4
Jyothy Laboratories
Neutral
369
-
6,710
1,440
2,052
11.5
13.0
8.5
10.0
43.5
36.9
10.5
9.7
18.6
19.3
4.9
3.4
Kirloskar Engines India
Neutral
380
-
5,495
2,554
2,800
9.9
10.0
10.5
12.1
36.2
31.4
15.1
14.3
10.7
11.7
1.8
1.6
Ltd
Linc Pen & Plastics
Neutral
260
-
384
382
420
9.3
9.5
13.5
15.7
19.3
16.5
3.3
2.9
17.1
17.3
1.1
1.0
M M Forgings
Neutral
594
-
717
546
608
20.4
20.7
41.3
48.7
14.4
12.2
81.4
72.0
16.6
17.0
1.2
1.0
Manpasand Bever.
Neutral
783
-
4,478
836
1,087
19.6
19.4
16.9
23.8
46.3
32.9
5.6
4.9
12.0
14.8
5.1
3.8
Mirza International
Neutral
149
-
1,791
963
1,069
17.2
18.0
6.1
7.5
24.3
19.8
3.7
3.2
15.0
15.7
2.1
1.9
MT Educare
Neutral
66
-
263
366
417
17.7
18.2
9.4
10.8
7.1
6.1
1.6
1.4
22.2
22.3
0.6
0.5
Narayana Hrudaya
Neutral
294
-
6,016
1,873
2,166
11.5
11.7
2.6
4.0
111.3
74.3
6.8
6.2
6.1
8.3
3.3
2.9
Navkar Corporation
Buy
206
265
2,943
369
561
42.9
42.3
6.9
11.5
29.9
17.9
2.1
1.9
7.4
10.5
9.0
5.9
Navneet Education
Neutral
161
-
3,763
1,062
1,147
24.0
24.0
6.1
6.6
26.5
24.3
5.4
4.8
20.6
19.8
3.6
3.4
Nilkamal
Neutral
1,916
-
2,858
1,995
2,165
10.7
10.4
69.8
80.6
27.4
23.8
109.5
95.1
16.6
16.5
1.4
1.3
Page Industries
Neutral
14,237
-
15,879
2,450
3,124
20.1
17.6
299.0
310.0
47.6
45.9
317.1
242.0
47.1
87.5
6.5
5.1
Parag Milk Foods
Neutral
239
-
2,013
1,919
2,231
9.3
9.6
9.5
12.9
25.3
18.5
3.9
3.2
15.5
17.5
1.2
1.0
Quick Heal
Neutral
209
-
1,466
408
495
27.3
27.0
7.7
8.8
27.0
23.8
2.5
2.5
9.3
10.6
2.7
2.3
Radico Khaitan
Buy
119
147
1,578
1,667
1,824
13.0
13.2
6.7
8.2
17.8
14.5
1.6
1.5
9.0
10.2
1.3
1.2
Relaxo Footwears
Neutral
472
-
5,670
2,085
2,469
9.2
8.2
7.6
8.0
62.4
59.4
24.2
20.7
17.9
18.8
2.8
2.4
S H Kelkar & Co.
Neutral
266
-
3,844
1,036
1,160
15.1
15.0
6.1
7.2
43.5
37.0
4.7
4.3
10.7
11.5
3.6
3.2
Siyaram Silk Mills
Neutral
1,785
-
1,673
1,652
1,857
11.6
11.7
92.4
110.1
19.3
16.2
2.8
2.5
14.7
15.2
1.2
1.1
Styrolution ABS India*
Neutral
721
-
1,268
1,440
1,537
9.2
9.0
40.6
42.6
17.8
16.9
45.4
41.2
12.3
11.6
0.8
0.7
Surya Roshni
Neutral
266
-
1,165
3,342
3,625
7.8
7.5
17.3
19.8
15.4
13.5
29.2
23.5
10.5
10.8
0.6
0.5
Team Lease Serv.
Neutral
1,153
-
1,971
3,229
4,001
1.5
1.8
22.8
32.8
50.6
35.1
5.4
4.7
10.7
13.4
0.5
0.4
The Byke Hospitality
Neutral
192
-
770
287
384
20.5
20.5
7.6
10.7
25.3
18.0
5.3
4.3
20.7
23.5
2.7
2.0
Transport Corporation of
Neutral
252
-
1,933
2,671
2,911
8.5
8.8
13.9
15.7
18.2
16.1
2.5
2.2
13.7
13.8
0.8
0.8
India
Stock Watch
May 26, 2017
Company Name
Reco
CMP
Target Mkt Cap
Sales ( Čcr )
OPM(%)
EPS (Č)
PER(x)
P/BV(x)
RoE(%)
EV/Sales(x)
(Č)
Price ( Č)
( Č cr )
FY17E FY18E FY17E FY18E FY17E FY18E FY17E FY18E FY17E FY18E FY17E FY18E FY17E FY18E
zOthers
TVS Srichakra
Neutral
3,902
-
2,988
2,304
2,614
13.7
13.8
231.1
266.6
16.9
14.6
438.4
345.2
33.9
29.3
1.3
1.1
UFO Moviez
Neutral
382
-
1,054
619
685
33.2
33.4
30.0
34.9
12.8
11.0
1.8
1.5
13.8
13.9
1.4
1.1
Visaka Industries
Neutral
358
-
569
1,051
1,138
10.3
10.4
21.0
23.1
17.1
15.5
45.9
43.0
9.0
9.2
0.8
0.8
VRL Logistics
Neutral
309
-
2,817
1,902
2,119
16.7
16.6
14.6
16.8
21.2
18.4
4.6
4.1
21.9
22.2
1.6
1.4
VIP Industries
Buy
188
218
2,650
1,270
1,450
10.4
10.4
5.6
6.5
33.5
28.9
7.0
6.1
20.7
21.1
2.1
1.8
Navin Fluorine
Buy
2,920
3,650
2,859
789
945
21.1
22.4
120.1
143.4
24.3
20.4
3.9
3.4
17.8
18.5
3.6
2.9
Source: Company, Angel Research; Note: *December year end; #September year end; &October year end; Price as on May 25, 2017
Market Outlook
May 26, 2017
Research Team Tel: 022 - 39357800
DISCLAIMER
Angel Broking Private Limited (hereinafter referred to as “Angel”) is a registered Member of National Stock Exchange of India
Limited,Bombay Stock Exchange Limited and Metropolitan Stock Exchange Limited. It is also registered as a Depository Participant with
CDSL and Portfolio Manager with SEBI. It also has registration with AMFI as a Mutual Fund Distributor. Angel Broking Private Limited is a
registered entity with SEBI for Research Analyst in terms of SEBI (Research Analyst) Regulations, 2014 vide registration number
INH000000164. Angel or its associates has not been debarred/ suspended by SEBI or any other regulatory authority for accessing
/dealing in securities Market. Angel or its associates/analyst has not received any compensation / managed or
co-managed public offering of securities of the company covered by Analyst during the past twelve months.
This document is solely for the personal information of the recipient, and must not be singularly used as the basis of any investment
decision. Nothing in this document should be construed as investment or financial advice. Each recipient of this document should make
such investigations as they deem necessary to arrive at an independent evaluation of an investment in the securities of the companies
referred to in this document (including the merits and risks involved), and should consult their own advisors to determine the merits and
risks of such an investment.
Reports based on technical and derivative analysis center on studying charts of a stock's price movement, outstanding positions and
trading volume, as opposed to focusing on a company's fundamentals and, as such, may not match with a report on a company's
fundamentals. Investors are advised to refer the Fundamental and Technical Research Reports available on our website to evaluate the
contrary view, if any.
The information in this document has been printed on the basis of publicly available information, internal data and other reliable
sources believed to be true, but we do not represent that it is accurate or complete and it should not be relied on as such, as this
document is for general guidance only. Angel Broking Pvt. Limited or any of its affiliates/ group companies shall not be in any way
responsible for any loss or damage that may arise to any person from any inadvertent error in the information contained in this report.
Angel Broking Pvt. Limited has not independently verified all the information contained within this document. Accordingly, we cannot
testify, nor make any representation or warranty, express or implied, to the accuracy, contents or data contained within this document.
While Angel Broking Pvt. Limited endeavors to update on a reasonable basis the information discussed in this material, there may be
regulatory, compliance, or other reasons that prevent us from doing so.
This document is being supplied to you solely for your information, and its contents, information or data may not be reproduced,
redistributed or passed on, directly or indirectly.
Neither Angel Broking Pvt. Limited, nor its directors, employees or affiliates shall be liable for any loss or damage that may arise from
or in connection with the use of this information.